Metro Vancouver Real Estate Market Update: September 2026
Metro Vancouver home prices have moved in a shape that's easy to miss if you only look at one month at a time: a partial recovery through 2024, then a second round of cooling through 2025 and into this year. Measured against the pandemic-era peak and the years before it, today's market sits well below its 2022 high but still above where it stood before the pandemic, and this year's sales pace is tracking below last year's. Here is what seven years of data show, and what it means if you are shopping in the months ahead.
Where today's prices sit against the pandemic-era boom
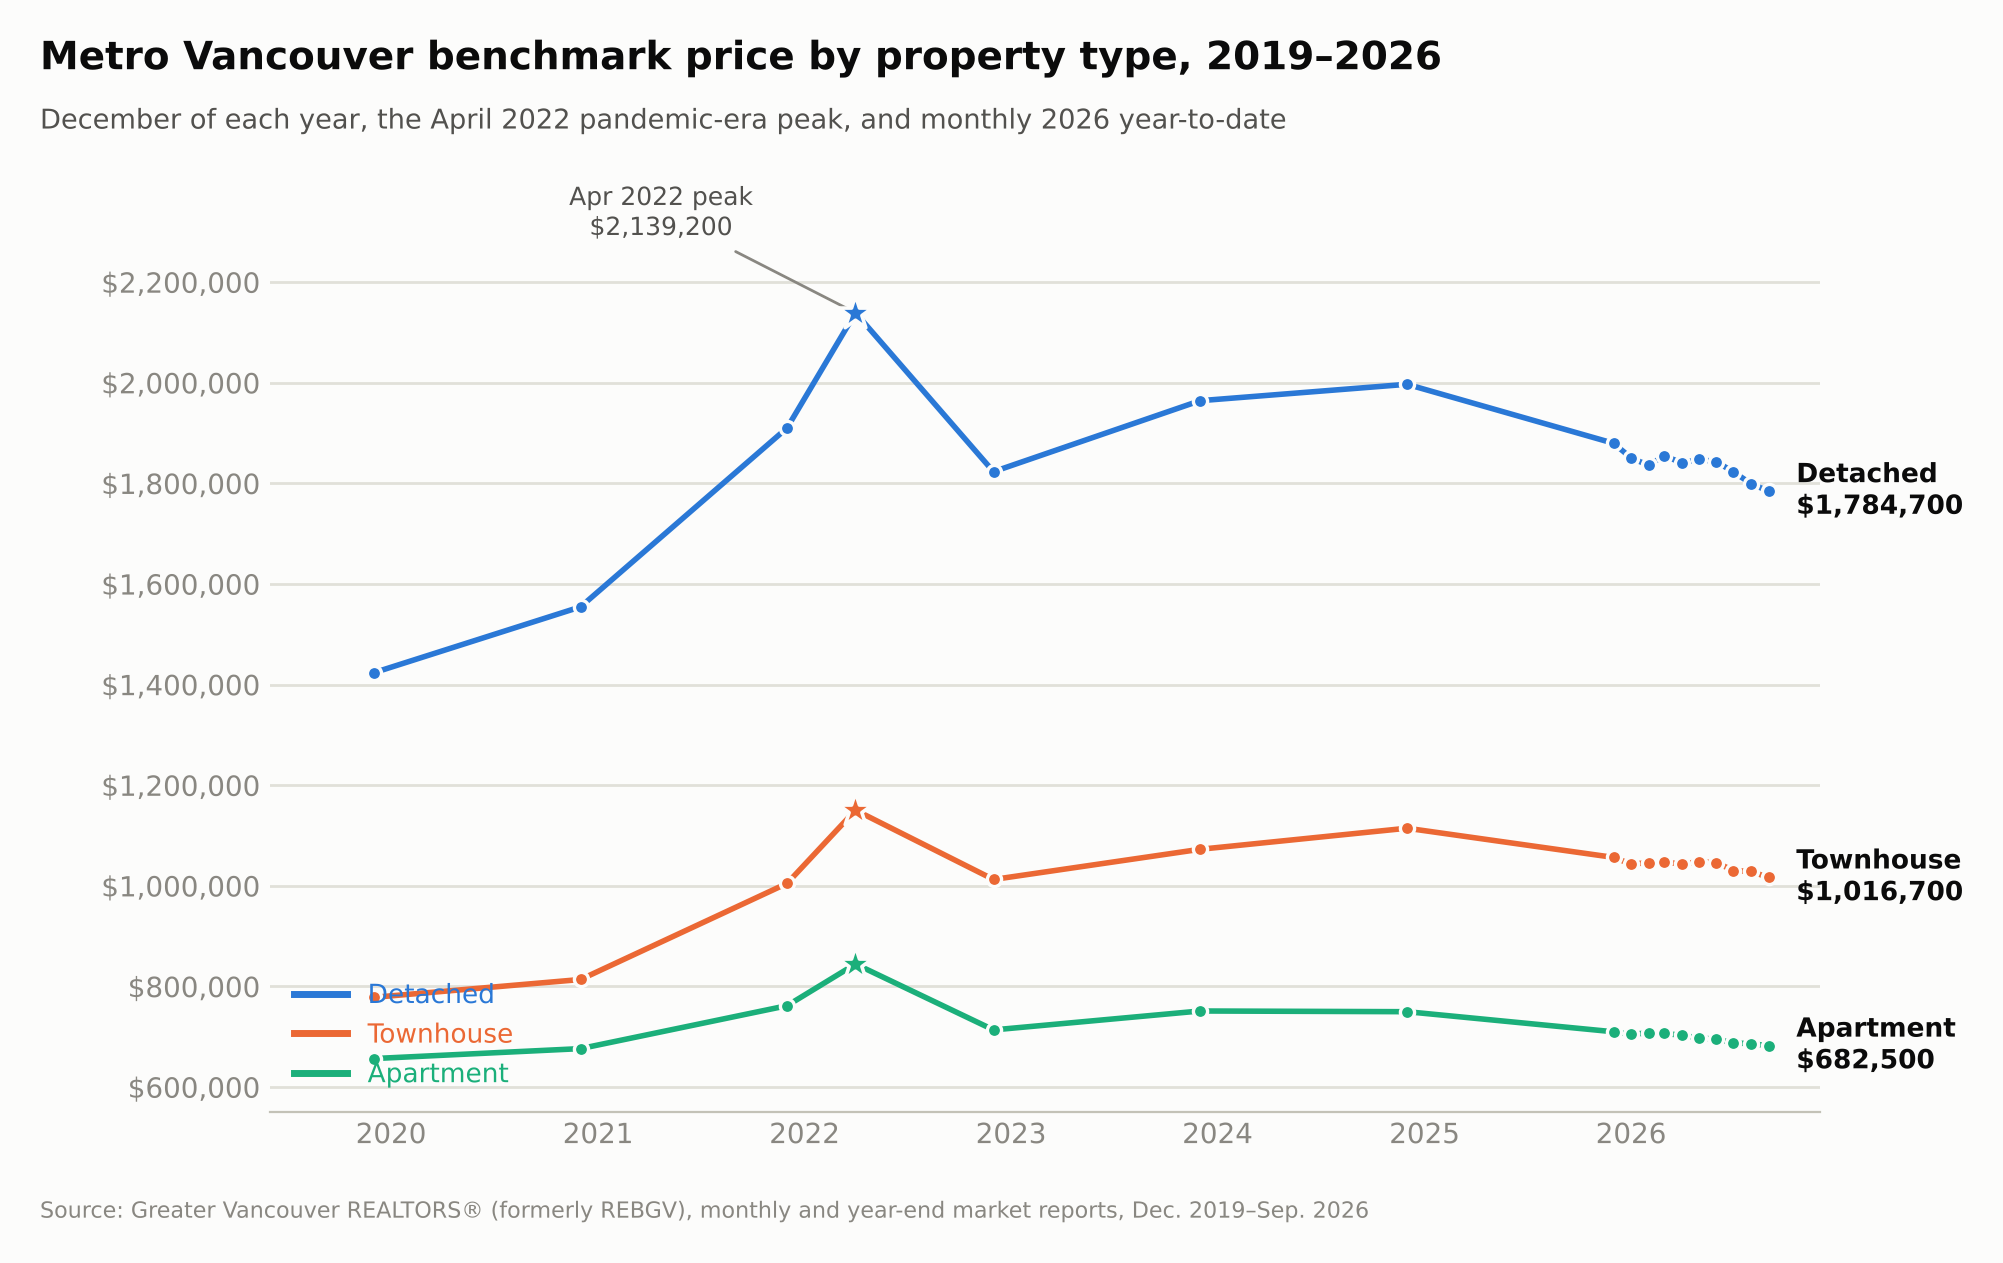
The benchmark price measures a "typical" home in a given category, and it moves more smoothly than the average sale price because it isn't skewed by a few very expensive or very cheap sales in a given month. Detached homes benchmarked at $1,423,500 in December 2019, according to GVR's December 2019 market report (GVR was known as REBGV, the Real Estate Board of Greater Vancouver, before its February 2024 rebrand). That benchmark climbed through the pandemic to a peak of $2,139,200 in April 2022, according to GVR's April 2022 report, before Bank of Canada rate hikes triggered a sharp correction. By September 2026 it had fallen to $1,784,700, roughly 17 percent below the April 2022 peak but still roughly 25 percent above its December 2019 level, according to GVR's September 2026 report.
Townhouses and apartments moved through the same three phases on a smaller scale. Townhouses ran from $778,400 in December 2019 to a $1,150,500 peak, and have since given back roughly 12 percent of that peak to sit at $1,016,700 today, still roughly 31 percent above their 2019 starting point. Apartments ran from $656,700 to an $844,700 peak, a smaller gain in percentage terms, and have given back roughly 19 percent of that peak to sit at $682,500 today, just roughly 4 percent above December 2019, essentially back to their pre-pandemic level.
A longer chart also shows something a single year can't: none of the three property types simply fell from the 2022 peak and kept drifting lower. Detached homes rebuilt to $1,997,000 by December 2024, within about 7 percent of the all-time high, according to GVR's December 2024 report, before cooling again to today's $1,784,700, a decline of roughly 11 percent from that level. Townhouses and apartments show the same pattern on a smaller scale, each roughly 9 percent below their own December 2024 highs. The takeaway: the current slide is a second, separate cooling period that followed a real recovery, not a straight-line continuation of the 2022 correction, which matters if you're judging whether today's prices are a floor or just a point partway down another leg.
This year's pace, measured against the last seven
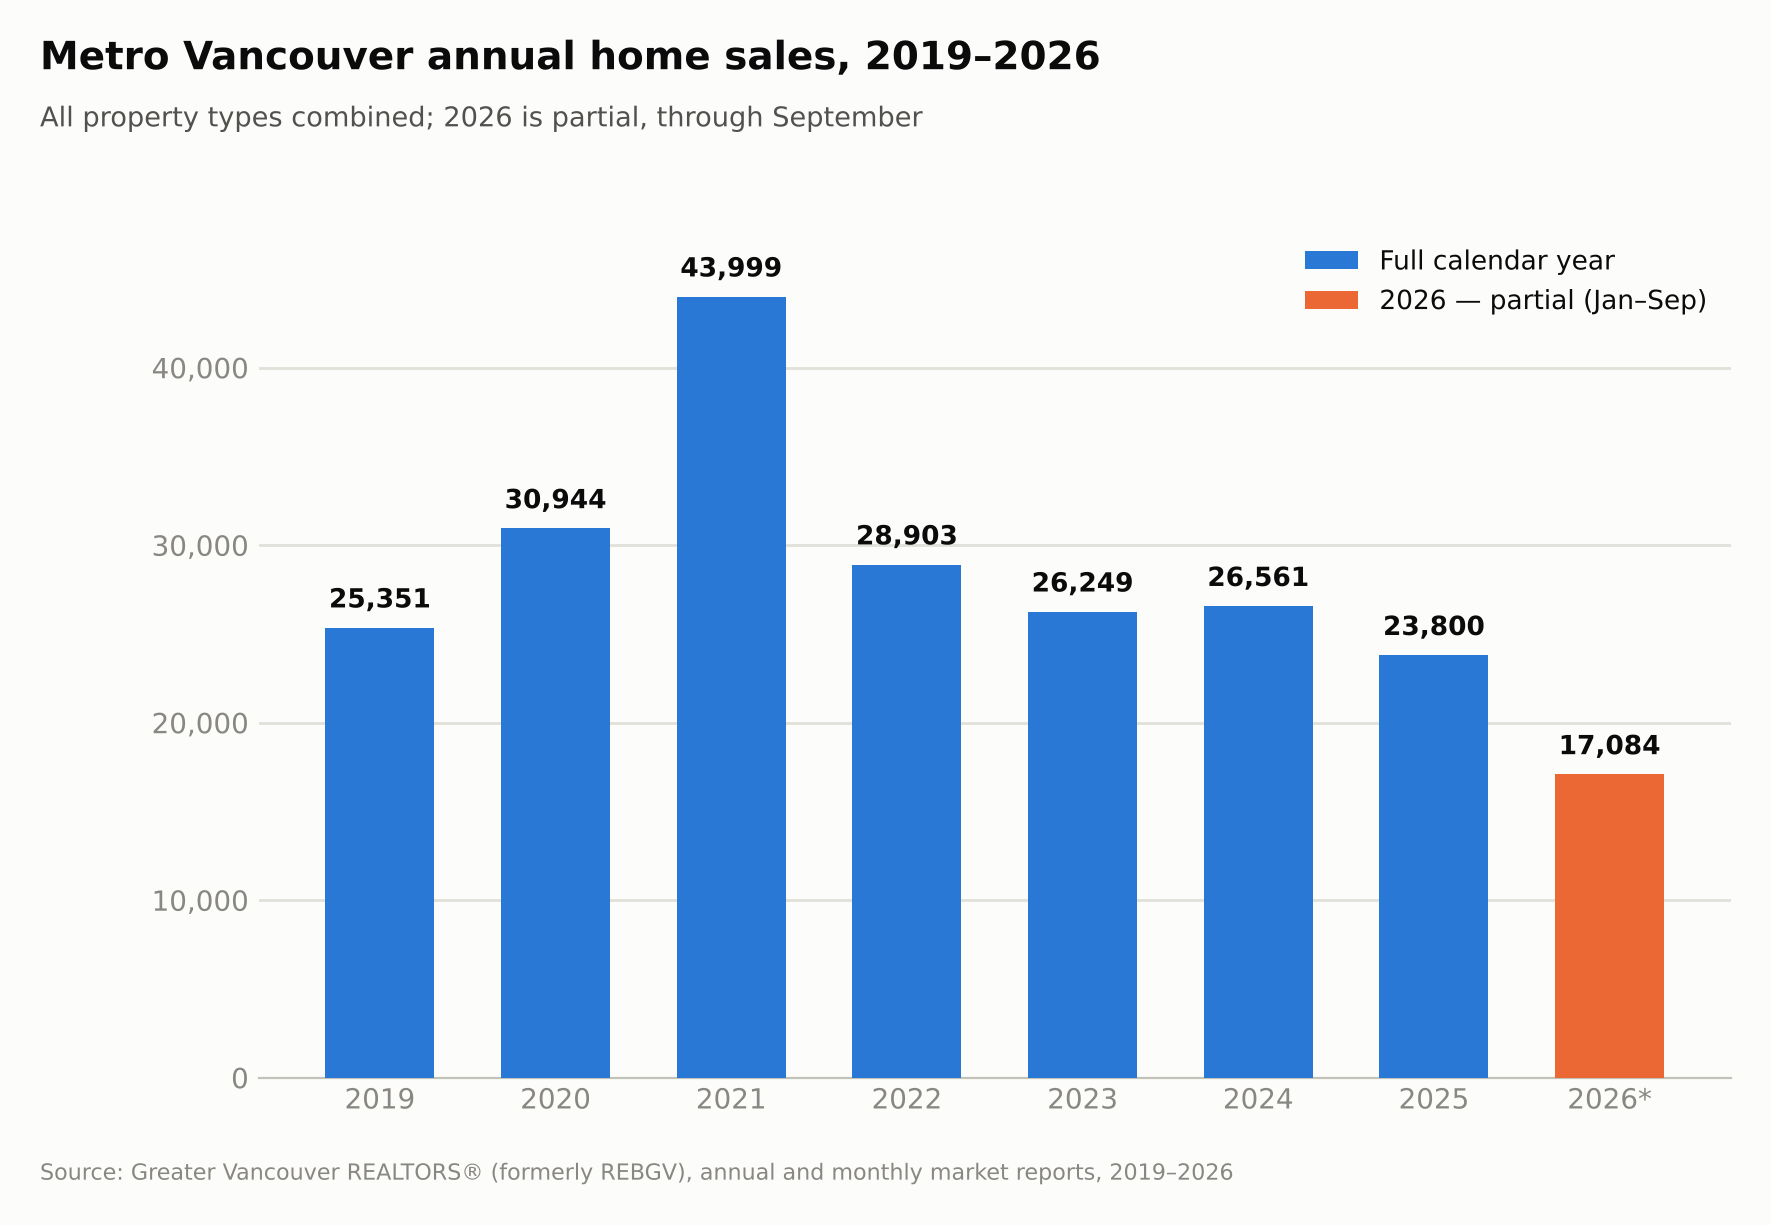
Sales volume shows a sharper version of the same cycle. Greater Vancouver recorded 43,999 home sales in 2021, the record year of the pandemic boom, roughly 74 percent above the 25,351 sales recorded in 2019, according to GVR's year-end reports for those two years. Sales fell sharply in 2022 and have since held in a narrower band, closing at 26,249 in 2023, 26,561 in 2024, and 23,800 in 2025, roughly 46 percent below the 2021 peak. Through the first nine months of 2026, sales total 17,084, already about 72 percent of all of 2025's full-year total. A partial-year figure can't reliably predict a full year, but on its current trajectory 2026 looks set to land close to, or modestly below, last year's total rather than mark a rebound.
What the current data shows
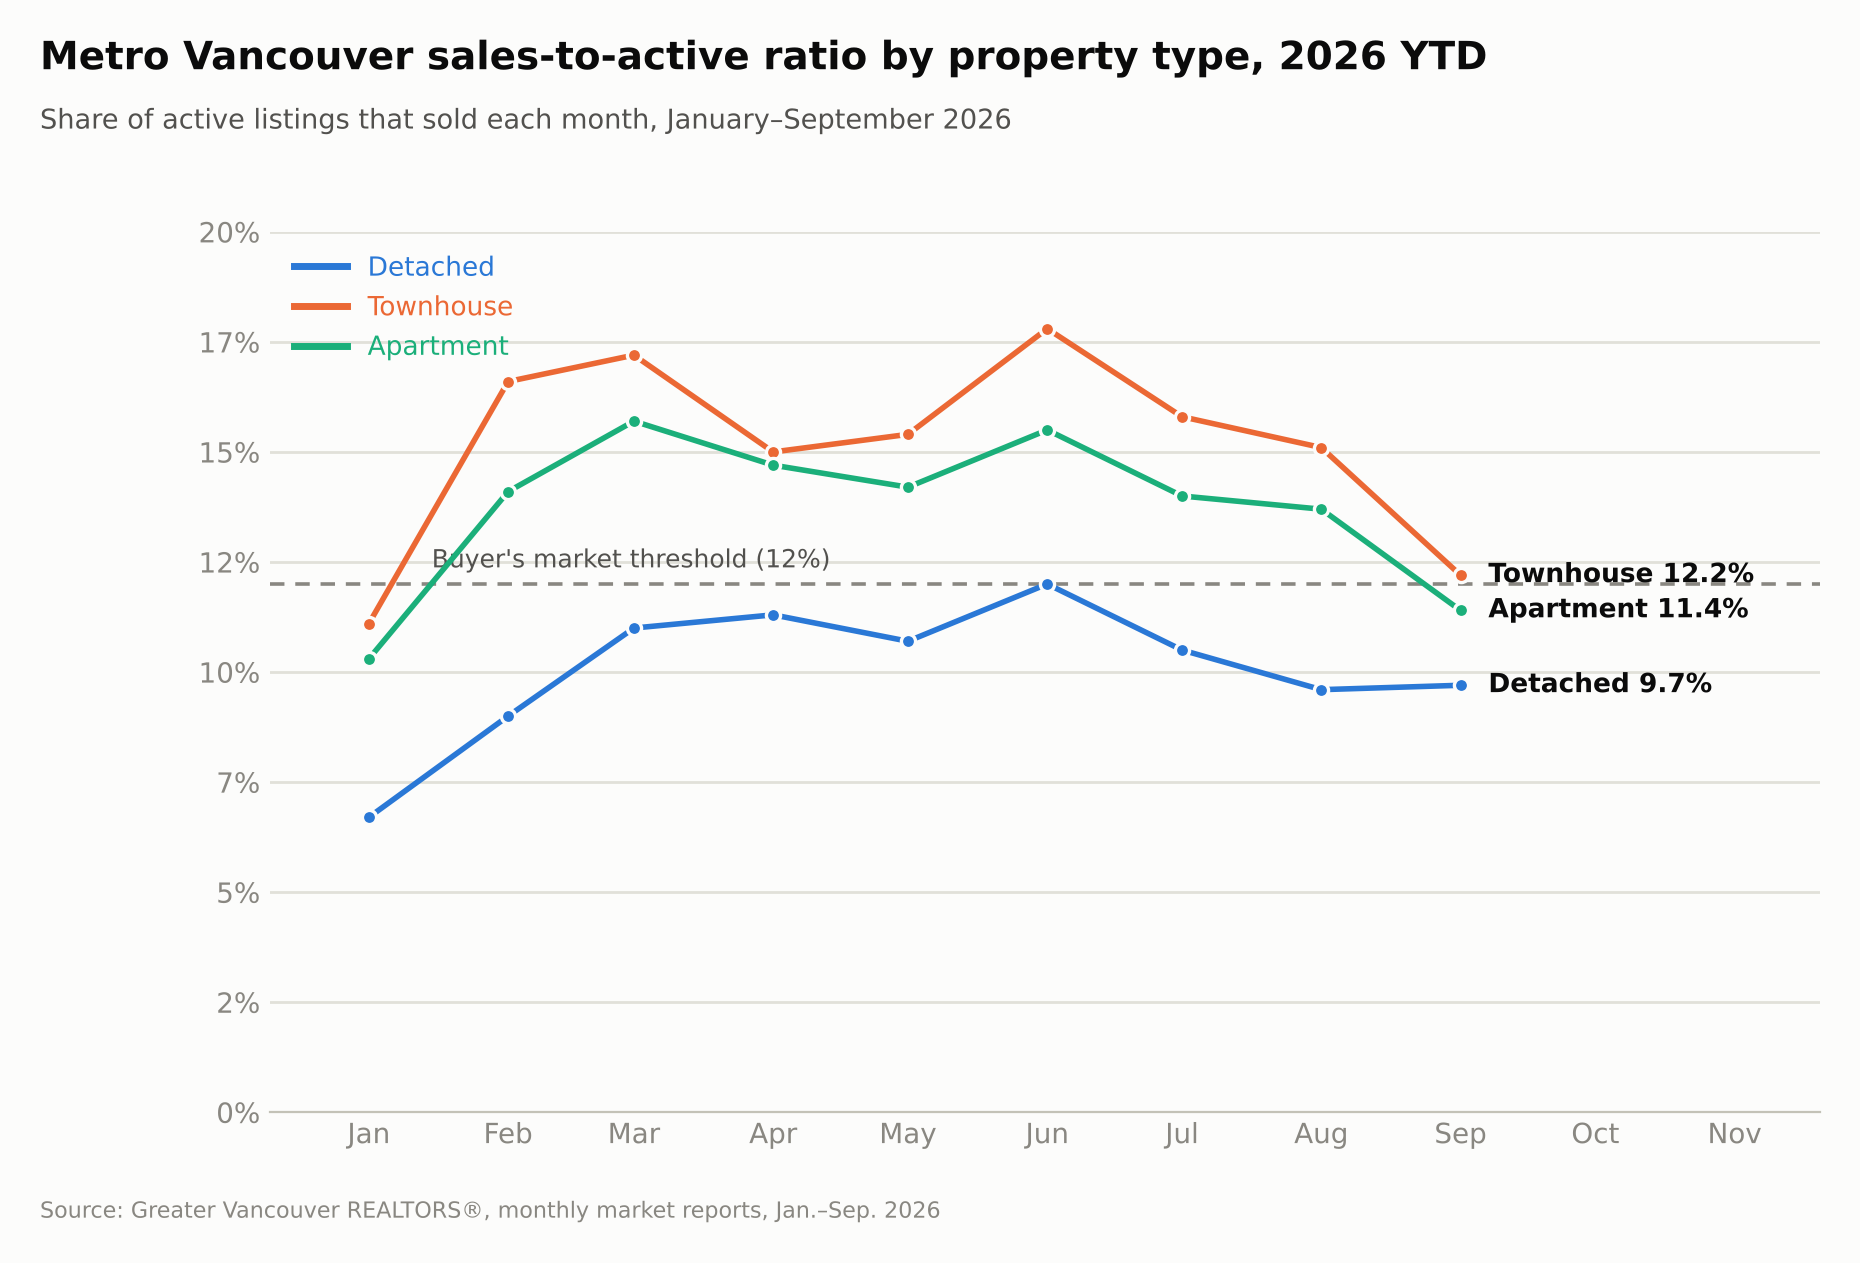
The sales-to-active ratio measures the share of listed homes that actually sell in a given month, and it is a useful gauge of near-term momentum because it moves faster than price does. Real estate boards, GVR included, generally treat a ratio above 20 percent as a seller's market, below 12 percent as a buyer's market, and the range in between as balanced.
Detached homes have spent every month of 2026 at or below that 12 percent line, touching a high of exactly 12.0 percent in June before easing to 9.7 percent in September, according to GVR's monthly market reports. Townhouses and apartments spent most of the year above the threshold, peaking in June at 17.8 percent and 15.5 percent respectively. September brought a sharp reversal for both: townhouses fell to 12.2 percent, right at the threshold and down from 15.1 percent in August, and apartments fell to 11.4 percent, dropping back into buyer's-market territory for the first time since January, according to GVR's September 2026 report. Detached demand held roughly steady by comparison. That split matches September's sales breakdown: detached sales rose 4.2 percent and attached sales rose 0.6 percent year over year, while apartment sales fell 18.6 percent, according to the same report.
Looking at the month itself, GVR's September 2026 report put the region's composite benchmark price at $1,075,900, down 5.5 percent from a year earlier, with 1,717 total sales, down 8.4 percent year over year. New listings, at 5,852, were down 10.3 percent, and active listings, at 16,394, were down 4 percent, meaning the recent pullback in supply has run alongside the pullback in demand rather than easing it. GVR Chief Economist Andrew Lis noted in the same report that weakness this month was "contained to the sizeable apartment segment," with end-user demand continuing to drive detached and attached home sales.
What this means if you're buying
The longer view changes the takeaway from "prices are down this month" into something more specific. All three property types are cheaper today than at their December 2024 local high, not just cheaper than the 2022 peak, meaning the softening has continued more recently than a peak-to-today comparison alone would suggest. Apartments have already given back nearly all of their pandemic-era gain and are trading close to where they stood seven years ago, and September's data shows that segment weakening fastest, which may mean more room to negotiate on condos specifically than on detached or attached homes right now. None of this is a forecast: a market that has cooled, partly recovered, and cooled again over four years can keep doing any of those things, and the only way to know is to keep watching the next report.
If you want a read on how these numbers apply to a specific property or neighbourhood, or you'd like early access to new listings before they're publicly searchable on MLS, get in touch directly.
Adam Crockford is a licensed REALTOR® with Oakwyn Realty, based in Metro Vancouver, focused on first-time home buyers. Get in touch with questions about this report or your own search.
Source: Greater Vancouver REALTORS® (formerly REBGV, the Real Estate Board of Greater Vancouver), monthly and annual market reports, December 2019 through September 2026.